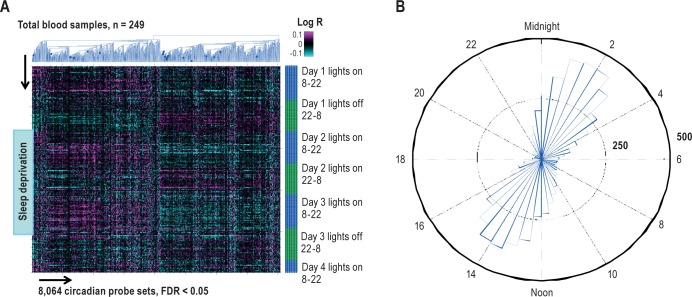
Figure 2.
A robust circadian signature identified in human blood. (A) Agglomerative hierarchical clustering (blue dendrogram) of the mixed-model 8,064 probes with significant 24-h circadian changes (false discovery rate [FDR] < 5%, x-axis) ordered by collection time on y-axis, mixed subjects (y-axis, total blood samples n = 249). The total sleep deprivation period is shown by blue block (start: day 2, 08:00, end: day 3, 10:00). Values shown are the log-transformed ratios (Log R) of observed expression values to the corresponding average across the initial baseline 24-h period for each subject. (B) The phase distribution of peak expression of the 8,064 probe sets (or 4,481 genes) with significant 24-h circadian cycling during baseline sleep and wake: 48-bin histogram (30 min each across 24 h) shows the number of probe sets that reach their maximum expression in a particular half-hour period. The peak time of day is calculated from the sine and cosine regression coefficients in the statistical model.

