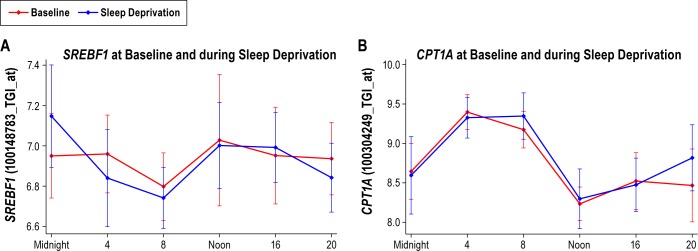
Figure 3.

The two genes with a significant linear trend in expression with sleep deprivation (false discovery rate < 5%); (A) SREBF1 and (B) CPT1A. Data are shown as mean ± standard deviation in normalized intensity on y-axis. The linear effects of sleep deprivation were very small for both genes: -0.03 and 0.06, respectively. No difference was found between sensitive and resistant subjects.
