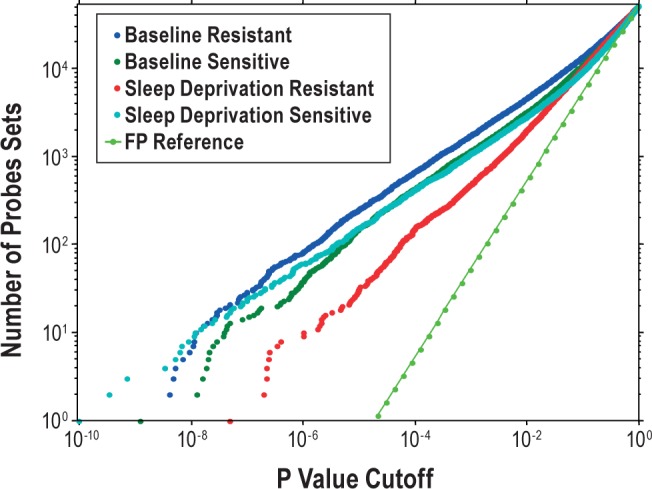
Figure 4.

Decreased number of cycling probe sets in behaviorally resistant subjects during sleep deprivation. The graph shows the cumulative distribution of the number of cycling probe sets across 24 h (y-axis) below a specified P value (x-axis) during baseline and sleep deprivation. Data are shown for behaviorally sensitive subjects and resistant subjects separately. Although both groups are almost identical at baseline, the resistant subjects show markedly less cycling probe sets during sleep deprivation than sensitive subjects. The reference line represents the expected number of false-positives (FP) calculated based on the uniform P value distribution that is expected under the null hypothesis.
