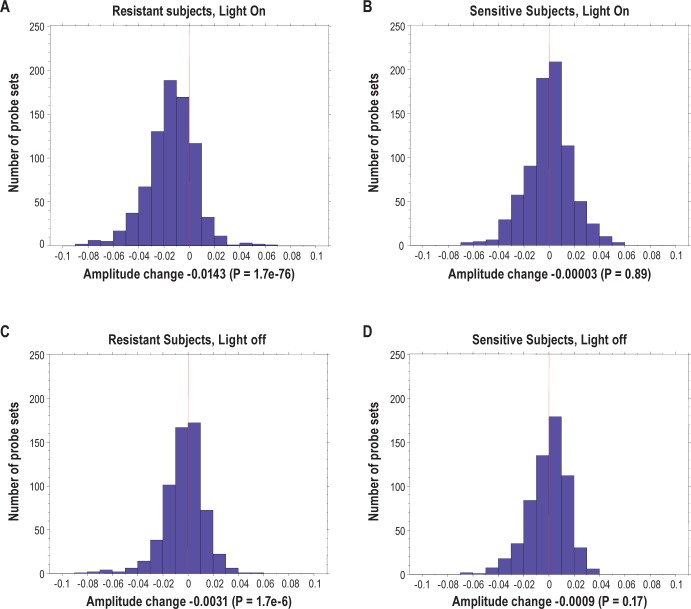
Figure 5.
Distribution of amplitude changes in behaviourally resistant (A and C) and sensitive (B and D) subjects from baseline to sleep deprivation using 1,397 most robust circadian probe sets (false discovery rate < 5%). Probe sets are divided into lights on (A and B) and lights off (C and D) based on their peak expression time. No significant changes are found in behaviorally sensitive subjects but a highly significant decrease in amplitude is found in resistant subjects, especially during lights on. The amplitude change is shown as sleep deprivation minus baseline.

