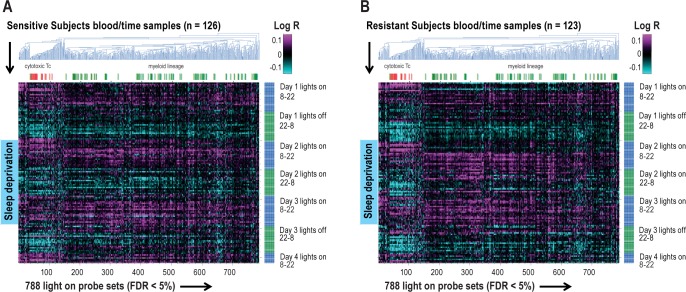
Figure 6.
Interindividual circadian differences in response to sleep deprivation. A reduction in the pattern of diurnal cycling during sleep deprivation is not found in behaviourally sensitive subjects (A), only in resistant subjects (B). The heat maps represent agglomerative hierarchical clustering of the 788 probe sets that peak during light on in both (A) sensitive and (B) resistant subjects, respectively (false discovery rate [FDR] < 5%), ordered by time (y-axis) in (A) sensitive and (B) resistant subjects, respectively. The log-transformed ratios (Log R) of observed expression values relative to the corresponding average across the initial baseline 24-h period for each subject are shown. There is a much larger reduction in the amplitude of diurnal cycling (amplitude) of the 788 probe sets in resistant subjects (B) than in sensitive subjects (A) when comparing the baseline and sleep deprivation periods, which predominantly was represented by myeloid lineage cells (green labeled). Cytotoxic T cell gene expression is shown in red d.

