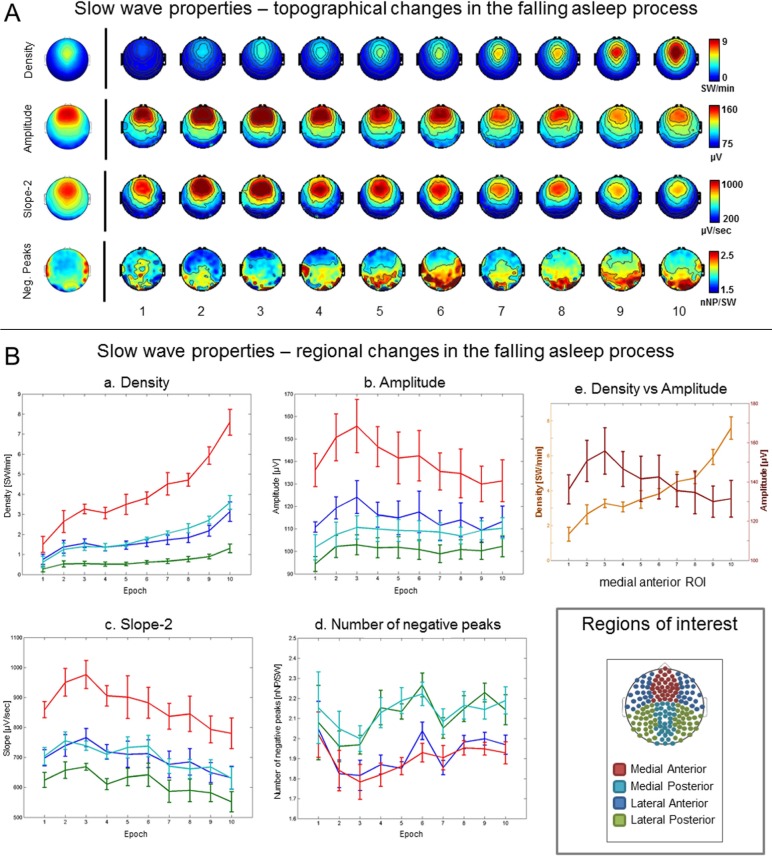
Figure 1.
Slow waves: regional changes. (A) Topographical changes in slow wave density (slow waves per min [SW/min], first row), amplitude ([μV], second row), slope-2, corresponding to the slope of the negative to positive deflection of the slow wave ([μV/min], third row) and number of negative peaks per wave ([nNP/SW], fourth row) for the 10 consecutive epochs of the falling asleep period (group average). The images on the left of the black vertical line show the topographical distribution of the same characteristics obtained when considering the falling asleep period as a whole. (B) Evolution of slow wave density (a), amplitude (b), slope-2 (d) and number of negative peaks (e) for the four regions of interest (ROI) and 10 consecutive epochs of the falling asleep period (group average). Both amplitude and number are plotted on the same graph for the medial anterior ROI only (e). The small panel on the bottom right corner shows the ROIs used for analysis.

