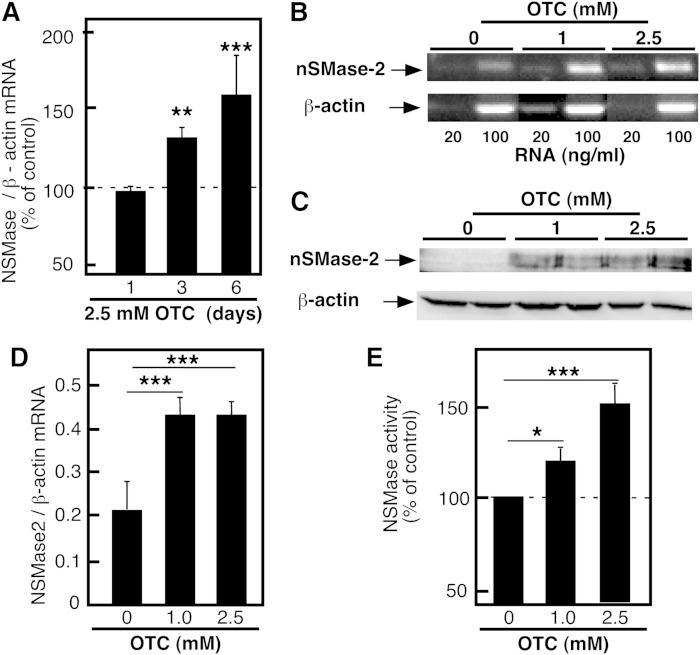
Fig. 6.
nSMase-2 protein and mRNA levels in HepG2 cells supplemented with OTC. HepG2 cells were cultured in complete growth medium supplemented with OTC (2.5 mM) for the indicated time (A) or for 6 days with the indicated concentrations (B–E). The levels of nSMase-2 mRNA were analyzed by real-time PCR (A) or quantitative RT-PCR (B, D). The levels of nSMase-2 protein were analyzed by Western blotting using nSMase-2 specific rabbit polyclonal antibody (C). β-Actin was used for normalization and as a control for equal loading. nSMase activity was measured in whole cell homogenates (D). Data are shown as a percent of the activity measured in vehicle-treated cells. Data are shown as mean values ± SD (n = 3). One-way ANOVA with Dunnett’s multiple comparison test are shown (*P < 0.05, ** P < 0.01, ***P < 0.001). Results are representative of at least three independent experiments.

