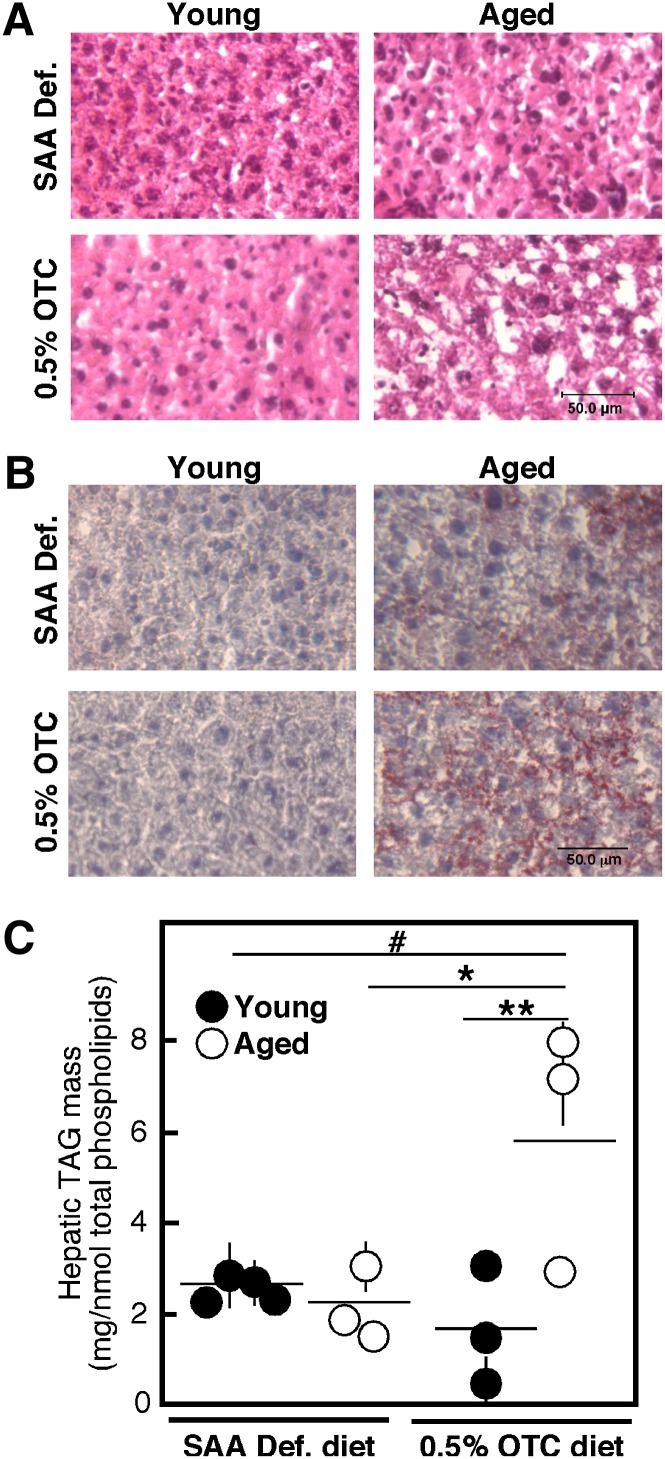
Fig. 7.
Liver histology and TAG levels. Young and aged C57Bl6 mice were placed on either a 0.5% OTC or a SAA def. control diet for 4 weeks. Freshly dissected liver portions were flash-frozen, sliced, and stained with H and E (A) or Oil Red-O (B). Slides are representative of all animals in each group. The scale bar corresponds to 50 μm. Hepatic TAG mass was measured in total lipid extracts using an L-Type Triglyceride M kit and normalized to the total phospholipid content (C). Data from an individual mouse are shown. Statistical analysis was done by two-way ANOVA followed by Bonferroni posttest analyses. The statistical significance of the main effects (aging and diet) is shown by asterisks (*P < 0.05, **P < 0.01). The statistical significance of the interaction effect is shown by a number sign (#P < 0.01).

