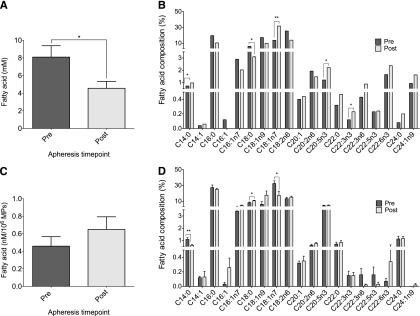
Fig. 3.
GC-FID analysis of MPs following apheresis. Total fatty acid concentration of plasma and MPs (A and C, respectively) followed by fatty acid profiling to determine compositional changes pre- to post-apheresis (B and D, respectively). Data are presented as mean ± SEM (n = 12). *P < 0.05, **P < 0.01.

