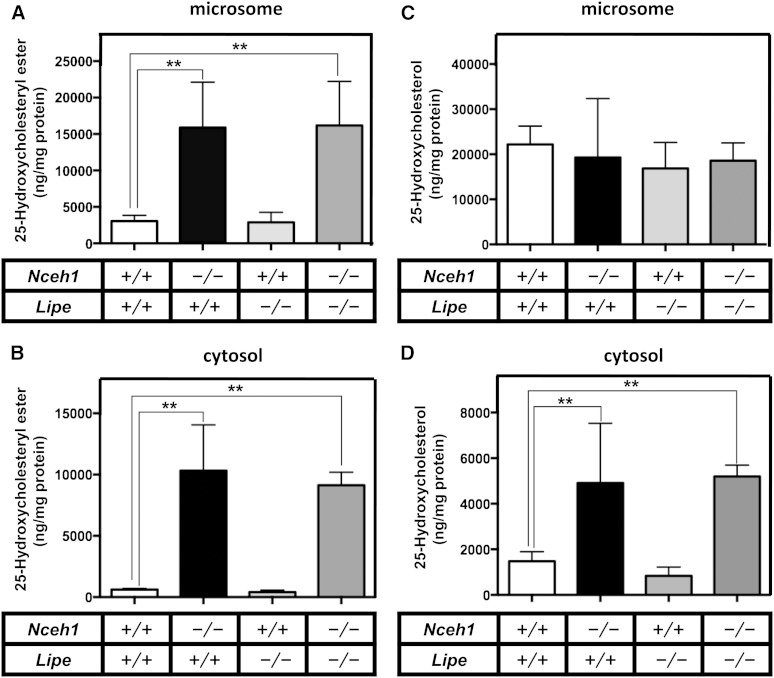
Fig. 7.
Quantification of free and esterified 25-HC in subcellular fractions. TGEMs plated at 5 × 10⁶ cells per 6 cm dish in 5–6 dishes were incubated with 10 μg/ml of 25-HC for 12 h. After cell fractionation, the lipids extracted from the cytosolic (B, D) and microsomal fractions (A, C) were subjected to LC-MS/MS to measure free (C, D) and esterified forms (A, B) of 25-HC. Data are expressed as the mean ± SEM. **P < 0.01; NS, nonsignificant difference.

