Fig. 1.
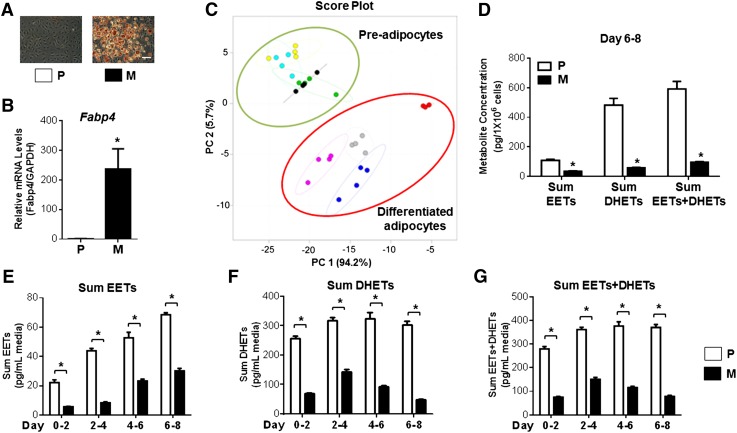
EET levels are reduced in 3T3-L1 mature adipocytes compared with preadipocytes. A: 3T3-L1 preadipocytes (P) and mature adipocytes (M) (differentiated for 8 days) were fixed and stained by Oil Red O (scale bar = 40 μm). B: Fabp4 mRNA levels were quantified by qRT-PCR (n = 3 per group) to confirm adipocyte differentiation. C: The culture medium was collected every 2 days during the differentiation period, and a total of 33 distinct eicosanoid metabolites were quantified by HPLC-MS/MS. A PCA demonstrates a clear separation of the global eicosanoid profiles across preadipocytes and differentiated adipocytes. Preadipocytes are shown as green dots (days 0–2), cyan dots (days 2–4), yellow dots (days 4–6), and black dots (days 6–8); differentiated adipocytes are shown as red dots (days 0–2), blue dots (days 2–4), gray dots (days 4–6), and purple dots (days 6–8). D: Specific evaluation of the CYP epoxygenase-derived arachidonic acid metabolite pathway demonstrated that the sum EET, sum DHET, and sum EET+DHET concentrations normalized by cell density (days 6–8) were significantly reduced in 3T3-L1 mature adipocytes compared with preadipocytes (n = 4 per group). E–G: The reduction of the sum EET (E), sum DHET (F), and sum EET+DHET (G) concentrations were apparent after 2 days and sustained throughout the entire differentiation period (n = 4 per group). *P < 0.05 versus preadipocytes.

