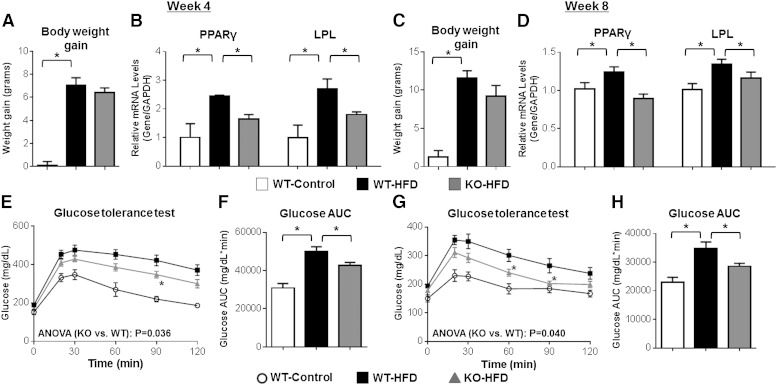
Fig. 9.
Ephx2−/− mice exhibit attenuated eWAT activation and glucose intolerance following HFD feeding. Ephx2−/− and WT mice were fed a HFD (D12079B) or control diet (WT-Control, n = 6; WT-HFD, n = 14; KO-HFD, n = 11) for 4 or 8 weeks. A, C: Total body weight gain from baseline was quantified at 4 weeks (A) and 8 weeks (C). B, D: PPARγ and LPL mRNA levels in eWAT at 4 weeks (n = 3 per group) (B) and 8 weeks (D) (WT-Control, n = 6; WT-HFD, n = 10; KO-HFD, n = 8) were quantified by qRT-PCR, normalized to GAPDH, and expressed relative to the control diet group. E–H: Blood glucose concentrations were quantified at baseline (fasting) and over 120 min following an intraperitoneal glucose tolerance test at 4 weeks (WT-Control, n = 6; WT-HFD, n = 14; KO-HFD, n = 11) (E) and 8 weeks (WT-Control, n = 6; WT-HFD, n = 10; KO-HFD, n = 8) (G). The repeated measures ANOVA P value is provided. The corresponding AUC at 4 weeks (F) and 8 weeks (H) was calculated. No significant differences in fasting [week 4 (E), P = 0.071); week 8 (G), P = 0.155] or fed (week 8, P = 0.516) glucose levels between Ephx2−/− and WT mice were observed. *P < 0.05 versus WT-HFD.

