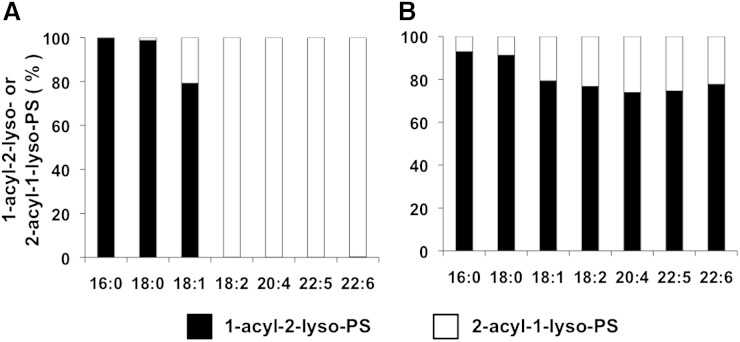
Fig. 4.
Distribution of 2-acyl-1-LysoPS and 1-acyl-2-LysoPS in the liver and the effect of pH. A: Phospholipids from mouse liver were dissolved in methanol by adding nine volumes of acid methanol (pH 4) and sonication, and were subjected to LC-MS/MS. The amount of 2-acyl-1-LysoPS and 1-acyl-2-LysoPS was quantified for each acyl chain (16:0, 18:0, 18:1, 18:2, 20:4, 22:5, and 22:6) and the ratio of 2-acyl-1-LysoPS and 1-acyl-2-LysoPS is shown for each fatty acid. B: Experiment was performed as in (A), except phospholipids were dissolved in neutral methanol.

