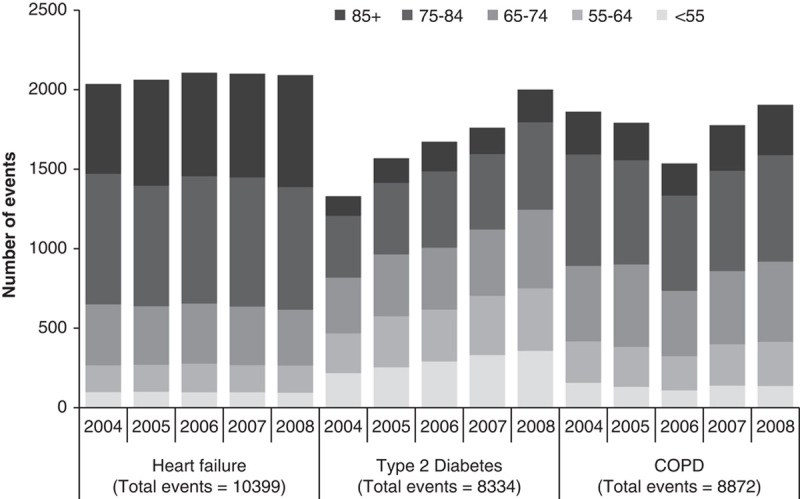
FIGURE 1.

Number of cardinal events by age and year. Shown are the numbers of cardinal events by year for associated with primary diagnoses of heart failure, type 2 diabetes, and COPD. The x-axis is marked by year and diagnosis group, the y-axis in number of cardinal events. Each bar is divided by age group and the total number for all age groups is indicated.
