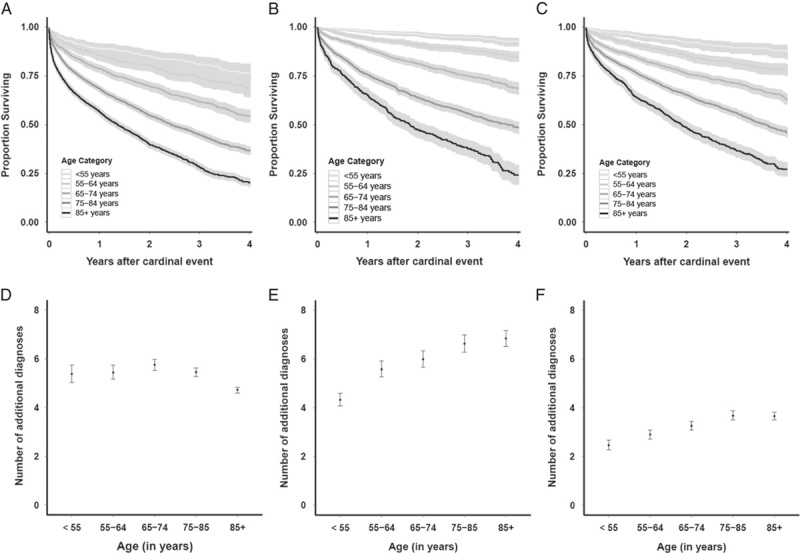
FIGURE 2.

Survival after cardinal events and number of additional diagnoses. Shown are the survival rates after cardinal events associated with heart failure (A), type 2 diabetes (B), and COPD (C). The x-axis is marked with years after a cardinal event, y-axis with proportion of individuals surviving. Lines represent survival curves for the following age groups (from light gray to dark gray as indicated): <55, 55–64, 65–74, 75–84, and 85+ years. The black central curve indicates the survival rates, and the gray upper and lower curves are the 95% CI. Below is shown the number of additional diagnoses (both estimate and 95% CI) at the time of cardinal event associated with heart failure (D), type 2 diabetes (E), and COPD (F). CI indicates confidence interval; COPD, chronic obstructive pulmonary disease.
