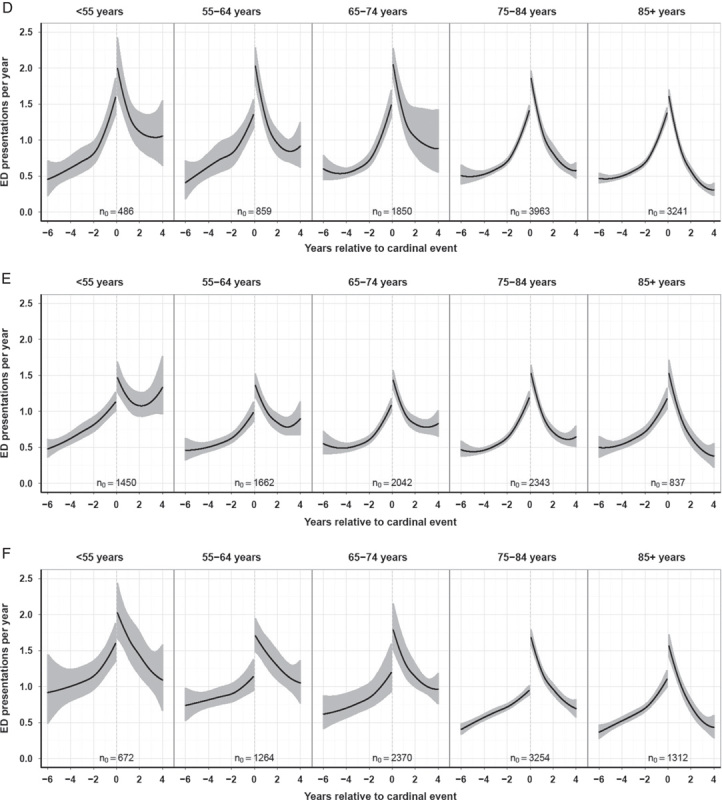
FIGURE 3.

Longitudinal analysis demand around cardinal events. Shown are the inpatient days per year (A–C) and ED presentations per year (D–F) associated with heart failure, type 2 diabetes, and COPD cardinal events in 5 age groups: <55, 55–64, 65–74, 75–84, and 85+ years. The cardinal event in each group occurs at the point on the x-axis, where “0” is indicated. Six years data before to 4 years data after the event is shown. n0 values indicate the number of cardinal events represented at time zero, that is, the day of the cardinal event. The black central curve indicates the line of best fit, and the gray upper and lower curves are the 95% CI. Heart failure (A, D), type 2 diabetes (B, E), and COPD (C, F). CI indicates confidence interval; COPD, chronic obstructive pulmonary disease; ED, emergency department.
