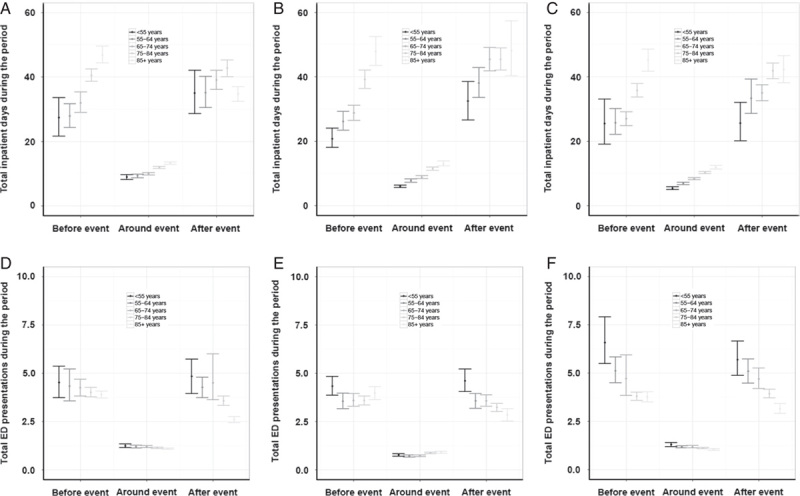
FIGURE 4.

Total inpatient days and ED presentations around a cardinal event by age group. Shown are the total mean number of inpatient days and ED presentations associated with a heart failure (A and D), type 2 diabetes (B and E), or COPD (C and F) cardinal event. The mean and 95% CI are indicated for 5 age groups: <55, 55–64, 65–74, 75–84, and 85+ years. “Before event” indicates the period 6 years before to the event (up to 31 d before the event), “around event” indicates the period around the event (from day −30 to day +30), and “after event” indicates the 4 years after the event (from +31 d onward). Inpatient days (A–C) and the total mean number of ED presentations (D–F) are shown. CI indicates confidence interval; COPD, chronic obstructive pulmonary disease; ED, emergency department.
