Figure 3.
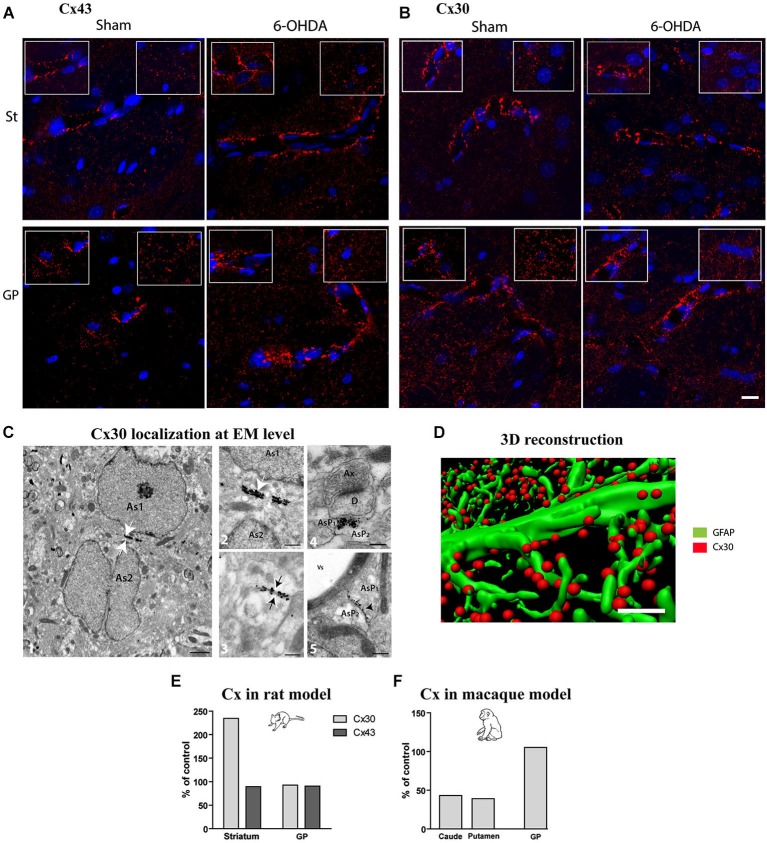
Qualitative and quantitative assessment of connexin 30 and 43 expression in rat and monkey models of PD. Connexin 43 (A) and 30 (B) distribution at cellular level in the striatum (top row) and GP (bottom row) of sham and 6-OHDA rat model of PD. Images correspond to the Z projection of six deconvolved 1 μm optical sections through section, red staining for Cx and blue for nucleus. Insets point out representative Cx immunolabeling around vessels (left) or in neuropil at distance from vessels (right) (scale bar = 10 μm). (C) 1-Representative electron micrographs showing Cx30 localization (scale bar = 1 μm); 2-symmetrically labeled gap junction between two astrocytic soma (white arrow; As = astrocyte) (scale bar = 0.5 μm) ; 3- symmetrically labeled gap junction between two astrocytic processes (black arrow; AsP = astrocytic process) (scale bar = 0.5 μm); 4-symmetrically labeled gap junction between two astrocytic processes close to asymmetrical synapse (scale bar = 0.5 μm); 5-asymmetrical labeled gap junction between two astrocytic processes (scale bar = 0.5 μm). (D) Illustration of quantification methodology of connexin based on double immunolabeling. GFAP immunostaining appears in green while Cx 30 immunostaining appears in red (scale bar = 2 μm). (E) Connexin Cx30 and Cx43 quantification in the 6-OHDA rat and (F) in MPTP monkey models of PD expressed in percentage of levels measured in control animals.

