Figure 3.
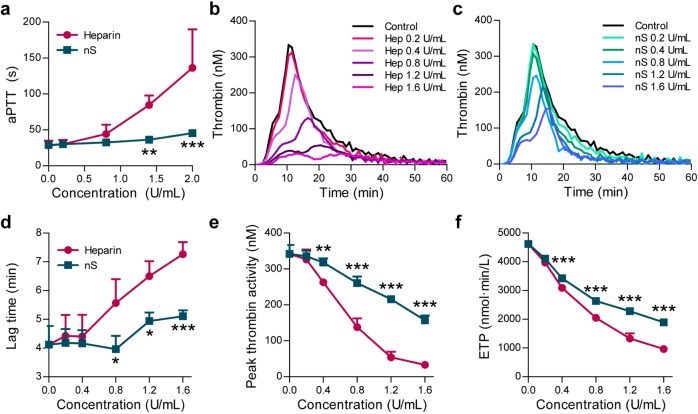
Ex vivo characterization of nanoSTATs in human plasma. (a) Activated partial thromboplastin time of normal human control plasma spiked with free heparin or nanoSTATs (nS) (**p < 0.01; ***p < 0.001 by two-way ANOVA with Bonferroni post test; n = 3 per condition, SD). (b, c) Real-time thrombin generation in plasma in the absence or presence of increasing concentrations of (b) free heparin (Hep) or (c) nanoSTATs (n = 3 per condition). (d) Lag time, (e) peak thrombin, and (f) endogenous thrombin potential (ETP) calculated from the thrombin generation assays in (b) and (c) (*p < 0.05 by two-way ANOVA with Bonferroni post test; n = 3 per condition, SD).

