
Figure 12.
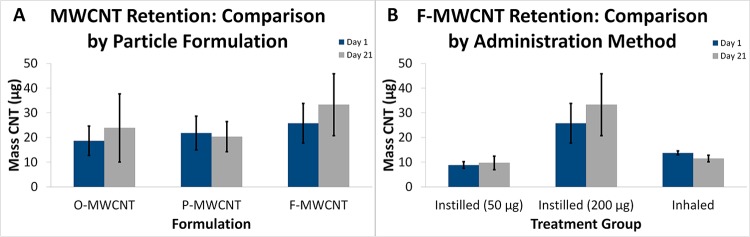
Programmed thermal analysis quantification of MWCNTs in lung tissue. (A) Day 1 and 21 time-course data from animals instilled with O-, P-, or F-MWCNTs. (B) Time-course data from animals exposed to F-MWCNTs by intratracheal instillation and inhalation.