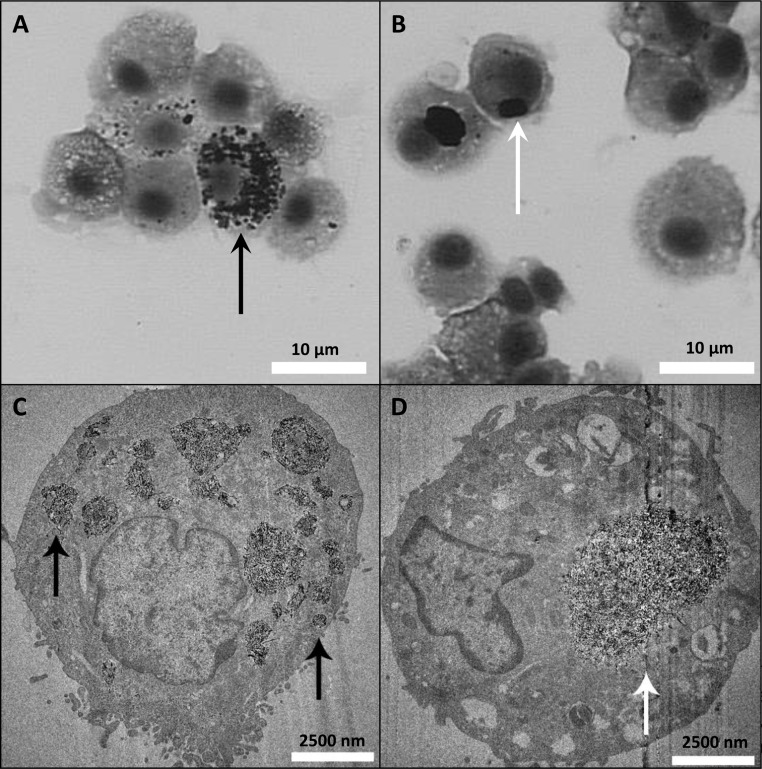
Figure 8.
Morphology of F-MWCNTs differs from O-MWCNTs in cells at 21 days postinstillation. Mφ recovered from BALF at 21 days postexposure to F-MWCNTs (A and C) and O-MWCNTs (B and D) by intratracheal instillation. Top panels are bright-field microscopy images of representative cells from rats exposed to a one-time bolus dose (200 μg) of MWCNTs. Results are mirrored in TEM images (bottom panels). F-MWCNTs appear as multiple dispersed aggregates within the Mφ (black arrows), while the O-MWCNTs are clustered within a much larger and single aggregate (white arrow). BAL cells were stained with Diff Qwik for bright-field microscopy.

