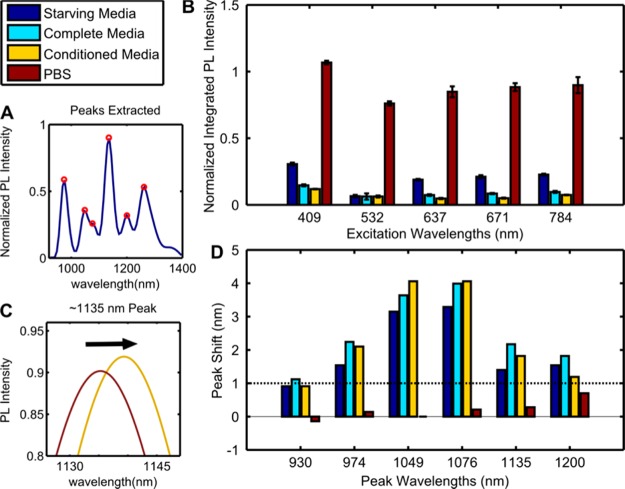
Figure 2.
Photoluminescence. (A) Example emission spectra from laser excitation. (B) Integrated PL emissions from five lasers normalized to preincubation PBS control (the PBS plotted is after experimental incubation). (C) Example peak-shift between control and conditioned media. (D) Peak-shifts from control. Dotted line indicating approximate instrument sensitivity.

