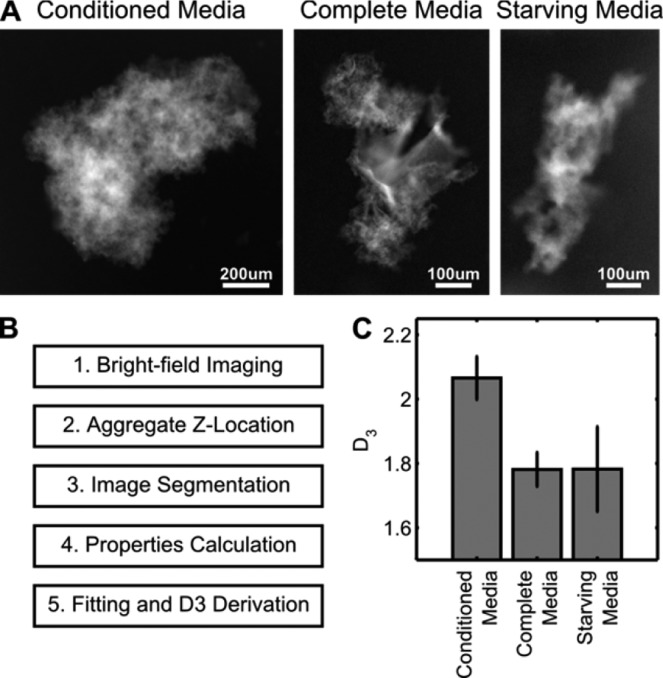
Figure 4.
Bright-field image analysis. (A) Inverted bright-field images of SWCNT aggregates formed from different media conditions, showing differences in size and structure. (B) Work flow of image analysis code. (C) Resulting D3 fractal coefficients from calculation show conditioned media aggregates with higher structural complexity.

