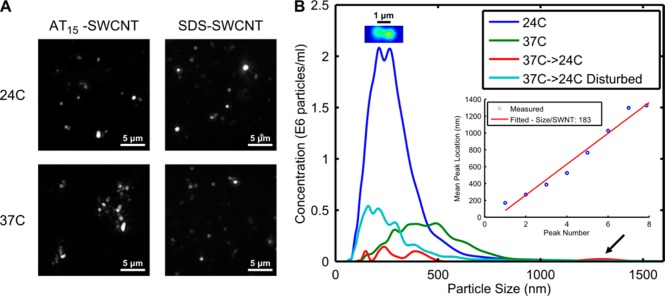
Figure 6.

SPT temperature response. (A) SPT of (AT)15–SWCNT shows aggregation formation following a change from 24 °C to 37 °C, a phenomenon not present with SDS–SWCNTs. (B) SPT analysis of particle size distribution for temperature changes and solution disturbance. Imaging of a SWCNT dimer shows two connected but distinct elements. Linear fitting of size peaks shows each SWCNT contributes 183 nm in particle size to the aggregate.
