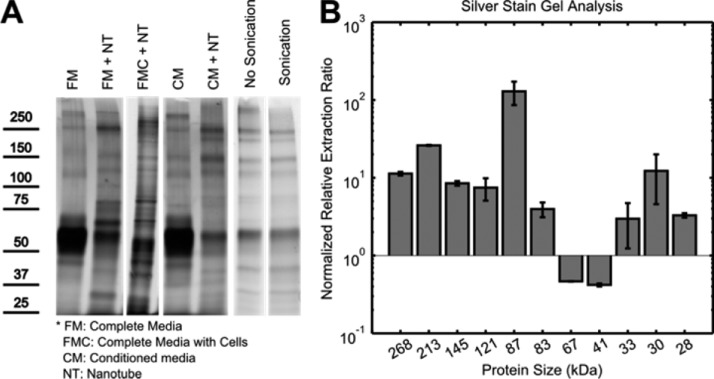
Figure 8.
Gel quantification. (A) Silver stain of proteins within SWCNT aggregates from full media, conditioned media, and in the presence of cells are compared along with control. A ∼500 kDa protein aggregate band is also observed, which can be eliminated via sonication. (B) Quantification of band intensities normalized to albumin shows differential SWCNT preference for certain protein species.

