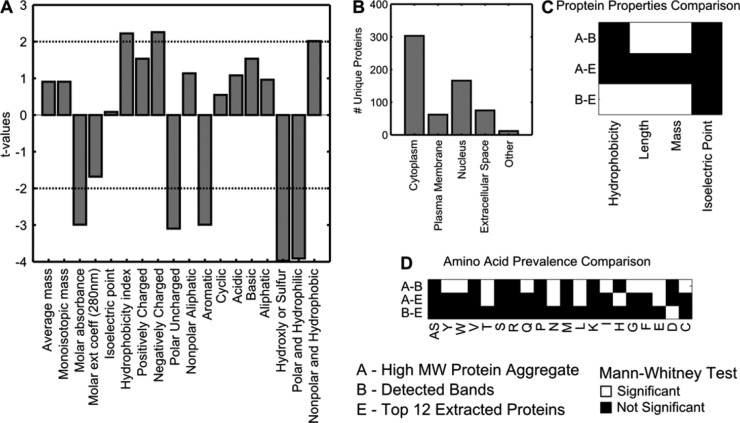
Figure 9.
Mass spectroscopy analysis. (A) Top 12 high-concentration proteins near the molecular weight of the gel bands are compared against BSA in a panel of material properties. Results show preferred proteins to be more hydrophobic and contain more charged amino acids. (B) Hydrophobicity versus length for detected protein species. (C) Detected protein cellular distribution, showing a majority to be either cytoplasmic or nuclear. Statistical tests for protein properties between three groups.

