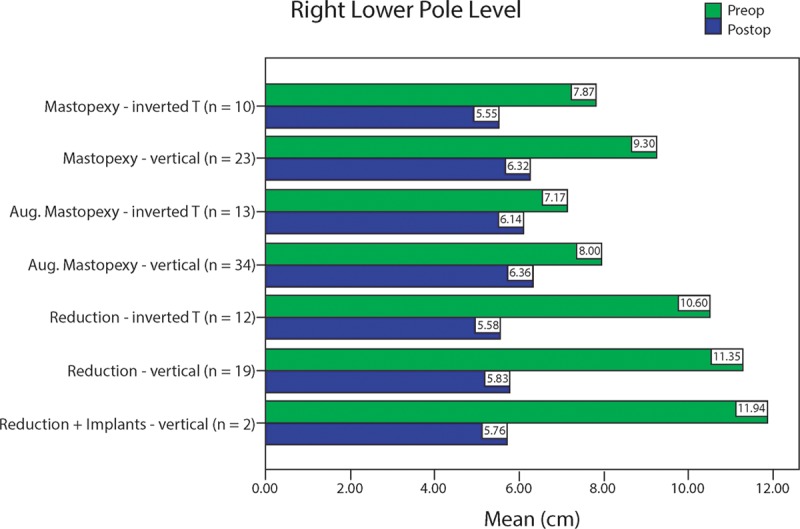
Fig. 7.

Right lower pole level before (green) and after (blue) surgery. These measurements represent vertical distances from the most inferior point on the breast to the plane of maximum postoperative breast projection. Smaller values indicated higher levels.
