
Fig. 1.
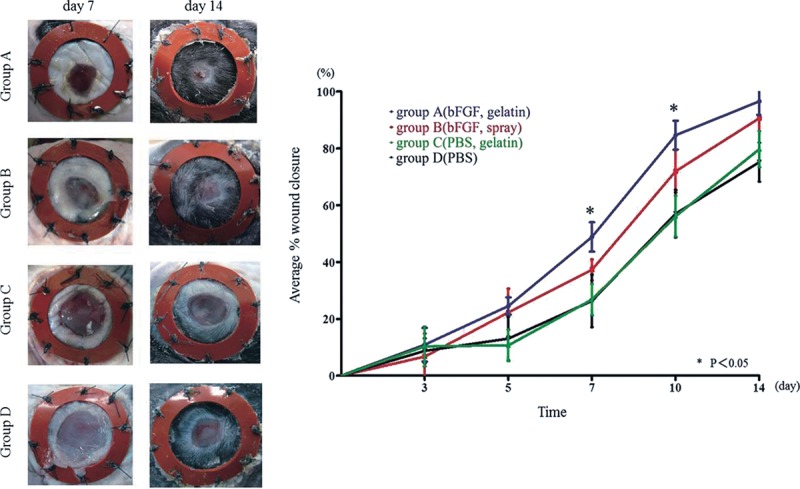
Time course of wound closure. A, Macroscopic photographs of wounds at day 7 and day 14 demonstrate the significantly faster wound closure in group A. B, Average wound closure from day 0 to day 14 [expressed as a percent of the day 0 control (100%)]. At day 7, group A showed a greater extent of wound closure compared with groups B, C, and D. At day 10, the difference between groups A and B disappeared, but there was a significant difference between the bFGF-treated groups and the non–bFGF-treated groups. *P < 0.05.