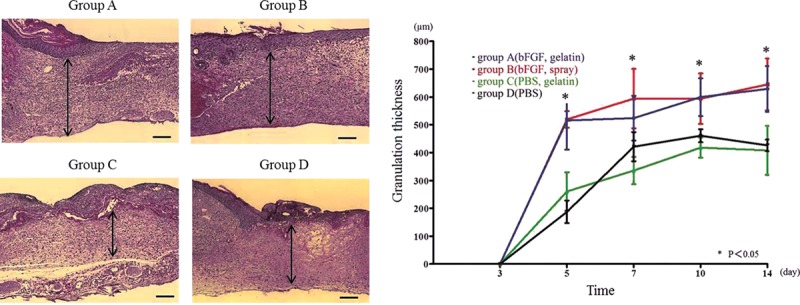
Fig. 2.

Histological evaluation and quantification of granulation thickness. A, Hematoxylin and eosin staining was performed to observe granulation thickness in each group at day 7. The arrow indicates the thickness of granulation, which was significantly greater in group A. B, Time course of granulation thickness shows a greater thickness in groups A and B compared with groups C and D at day 5, 7, 10, and 14 (bar: 200 µm). *P < 0.05.
