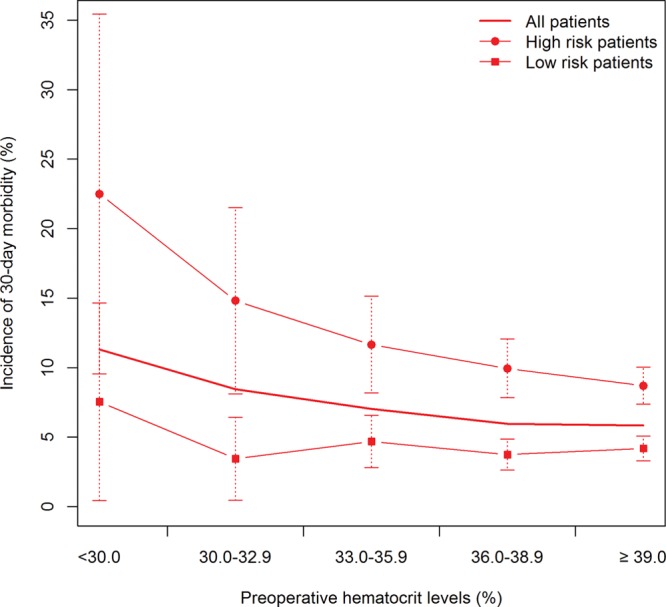
Fig. 1.

Dose-response curve of incidence of 30-d morbidity events for high- and low-risk groups vs preoperative hematocrit level. The incidence of 30-d morbidity with 95% CI is calculated for patients in 5 different categories of preoperative hematocrit level: <30.0, 30.0–32.9, 33–35.9, 36–38.9, and ≥39.
