
Figure 5.
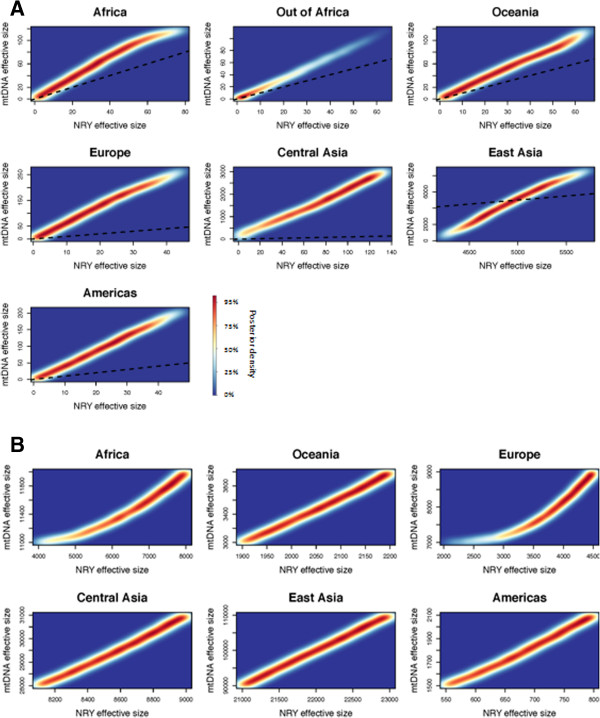
Distribution of Nf and Nm values, based on simulations. The density of the top 1% of the posterior values obtained from simulations of the mtDNA and NRY sequences are shown. (A) ancestral effective population sizes; (B) current effective population sizes. The dashed line in each plot follows a 1:1 ratio.