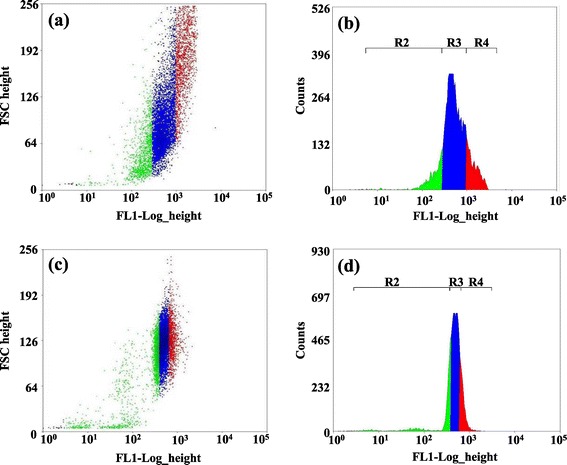
Figure 1.

Two dimensional dot plots (a, c) and flow cytograms (b, d) of BODIPY 505/515-stained 0 hour seed cells of CC124 (a, b) and sta6-1 (c, d). Region R2 (green), R3 (blue), and R4 (red) in flow cytograms represent low, medium, and high lipid content cells, respectively. A total of 25,000 cells from the top 2 to 3% of R4 region were sorted and regenerated in nitrogen depletion and repletion TAP medium, separately. The mean values of the histograms of the seed cells of CC124 and sta6-1 were 662.11 and 494.35, respectively. Abbreviations: BODIPY, 4,4-difluoro-1,3,5,7-tetramethyl-r-bora-3a,41-diaza-s-indacene.
