
Figure 3.
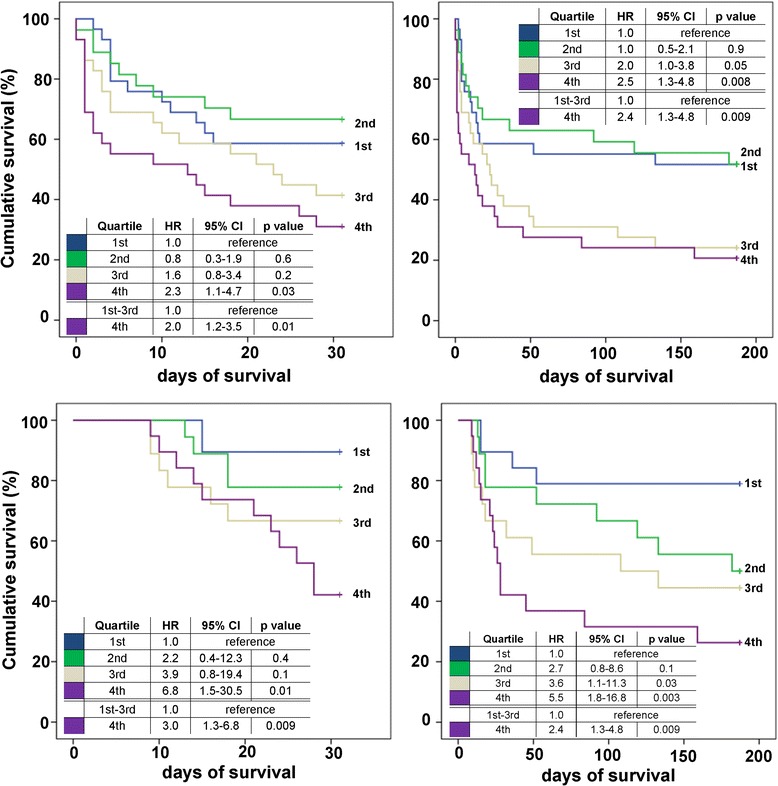
Kaplan-Meier survival curves evaluated by quartiles of presepsin after 30 days (left column) and 6 months (right column) of follow up in the total study cohort (n = 116). Hazard ratios (HR) were calculated for each risk group according to presepsin quartiles measured at day 1 (top) and day 8 (bottom).