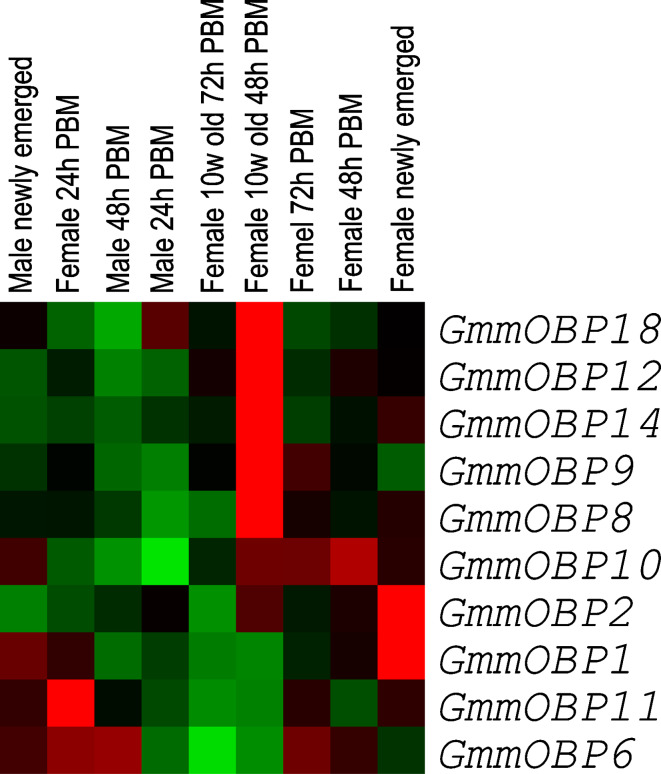
Fig. 5.
Cluster analysis of transcription profiles of OBP genes in antennae of Glossina morsitans morsitans based on the results in Fig. 4. The transcript abundance is represented with coloured squares; red squares indicate transcription higher than average and green squares indicate transcription lower than average. PBM Post-blood meal

