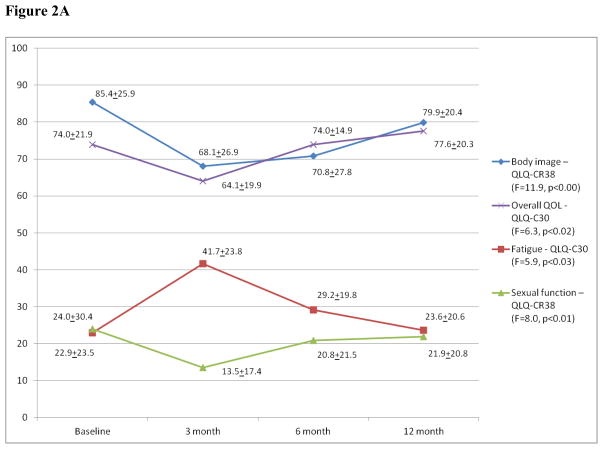
Figure 2.
Figure 2A: Overall QOL/Body Image/Sexual Function/Fatigue*
*: Mean scores of various scales for all the patients at the four time points. Higher scores in a function scale or overall QOL indicate better function while higher fatigue scores reflect worsening fatigue; QLQ-C30: European Organization for Research and Treatment of Cancer Quality of Life Questionnaire; QLQ-CR38: Colorectal cancer module of the QLQ-C30.
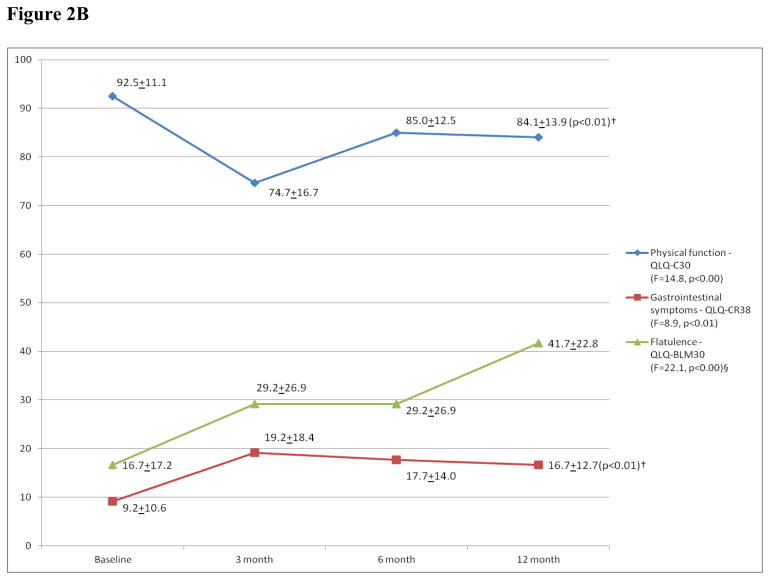
Figure 2B: Physical Function/Gastrointestinal symptoms*
*: Mean scores of two scales and a symptom item (§) for all the patients at the four time points. Higher physical function scores indicate better function while higher scores in a symptom scale/item reflect worse symptomatology; QLQ-C30: European Organization for Research and Treatment of Cancer Quality of Life Questionnaire; QLQ-BLM-30: Muscle invasive bladder cancer module of the QLQ- C30; QLQ-CR38: Colorectal cancer module of the QLQ-C30.
†: Pairwise comparisons between T0 and T3 were statistically significant.


