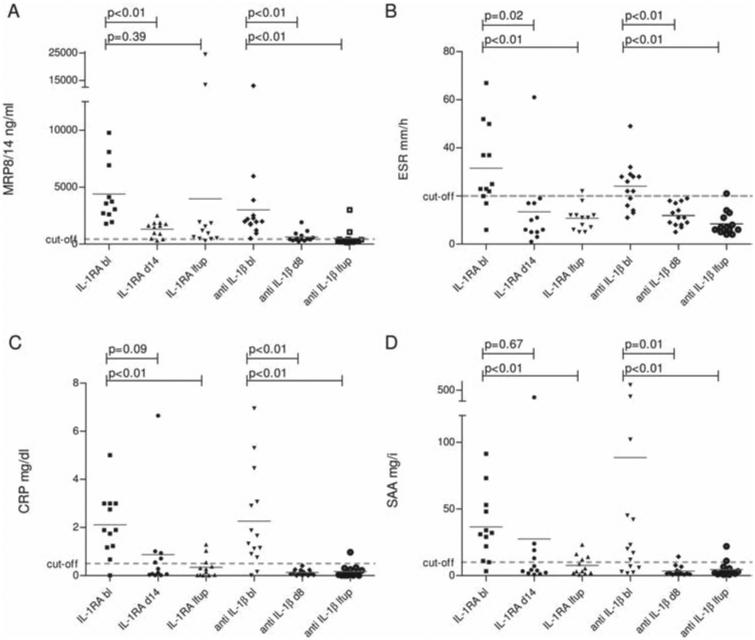
Figure 1.
Interleukin (IL-1) blockade in patients with Muckle–Wells syndrome (MWS): anakinra versus canakinumab. (A) Serum concentrations of MRP8/14 (myeloid-related proteins); (B) ESR (erythrocyte sedimentation rate); (C) CRP (C-reactive protein) and (D) SAA (serum amyloid A) were determined in anakinra- (N=12) and canakinumab-treated patients with MWS (N=14) at baseline, short-term (day 14 in anakinra-treated patients, and day 8 in canakinumab-treated patients) and last follow-up (4–19 months in anakinra-treated patients, and 6–15 months in canakinumab-treated patients). The scatter plot depicts the measured values for each patient. Horizontal grey line indicates mean. Dashed grey lines indicate the upper limit of healthy individuals (MRP < 450 ng/ml, ESR < 20 mm/h, CRP < 0.5 mg/dl, SAA < 10 mg/l).

