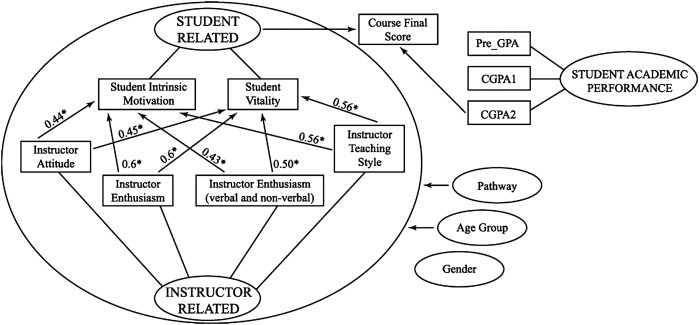
Figure 1.
Schematic illustration of study findings. Values represent Pearson's r correlation coefficients (*p<0.001) between faculty and student related items. Pre-GPA (Pre-requisite Grade Point Average), CGPA1 and CGPA2 (Cumulative Grade Point Average academic year 1 and academic year 2, respectively). Gender did not show correlation to any of the variables.

