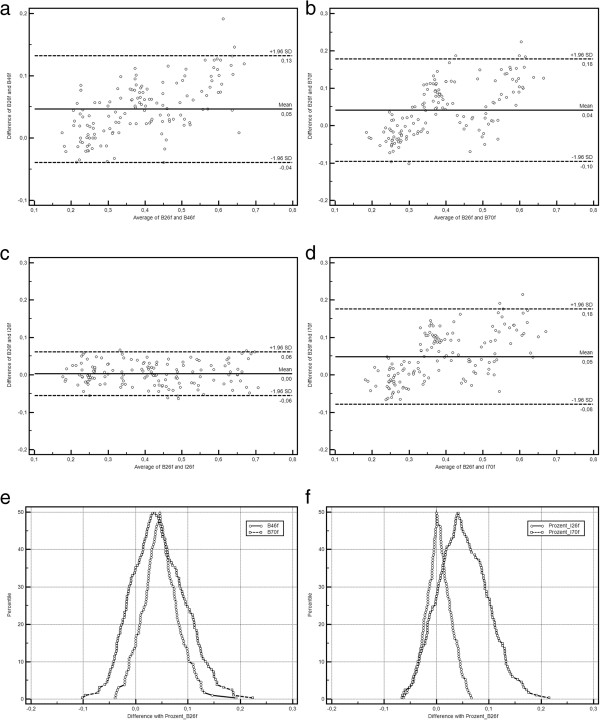
Figure 6.

Method comparison plots for kernel comparisons (a-d Bland-Altman plots, e-f mountain plots). Shown are the differences between the standard B26f and the other kernels under investigation (a, e: B46f, b, e: B70f, c, f: I26f, d, f: I70f). While for B26f and I26f align perfectly, skewed distributions with outliers are visible for all other comparisons.
