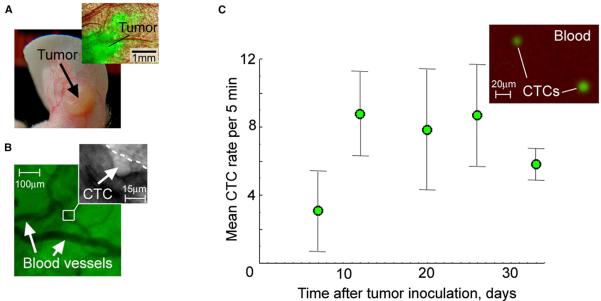
Figure 4. In Vivo Monitoring of Primary Tumor and CTCs in Mice with Metastatic Carcinoma.
(A) Photo of the ear tumor and combined fluorescence-transmission microscopic image of the tumor area of interest (inset).
(B) Imaging of intratumor vessels and intravascular rolling of a CTC (inset).
(C) CTC kinetics in mice bearing ear tumors (n = 7). In vivo measurements at the final point of tumor development were verified by fluorescent imaging of blood samples in vitro (inset). Error bars represent SEM.
See also Figure S6.

