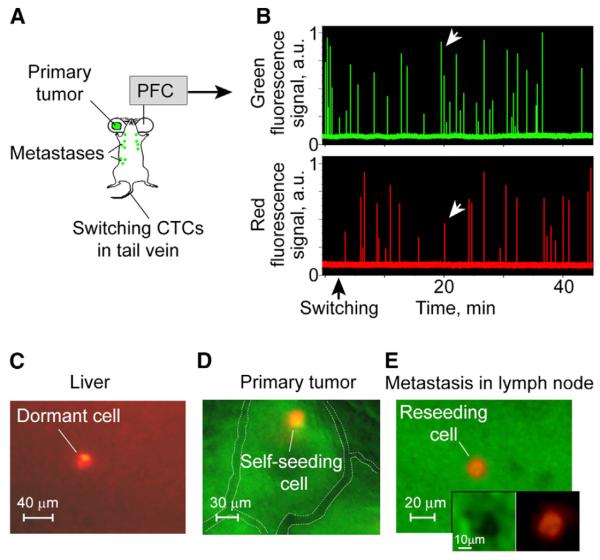
Figure 6. Dormacy, Self-Seeding, and Reseeding.
(A and B) Workflow of photoswitching of CTCs in a tail vein (A) and monitoring CTCs in the green and red channels (B); the white arrows indicate the signals from a partly switched CTC.
(C) Combined, transmission and fluorescence, image of the dormant cell in liver (day 9 after CTC photoswitching); the red fluorescence of the dormant cell is 18-fold higher than the autofluorescence of an intact liver.
(D and E) Combined images from the green and red fluorescence channels of self-seeding (D) and reseeding (E) cells with a 48-fold and 77-fold, respectively, increase of red fluorescence compared to a green primary tumor or existing metastasis; visible vessels indicated by white dotted lines.
See also Figures S2 and S6.

