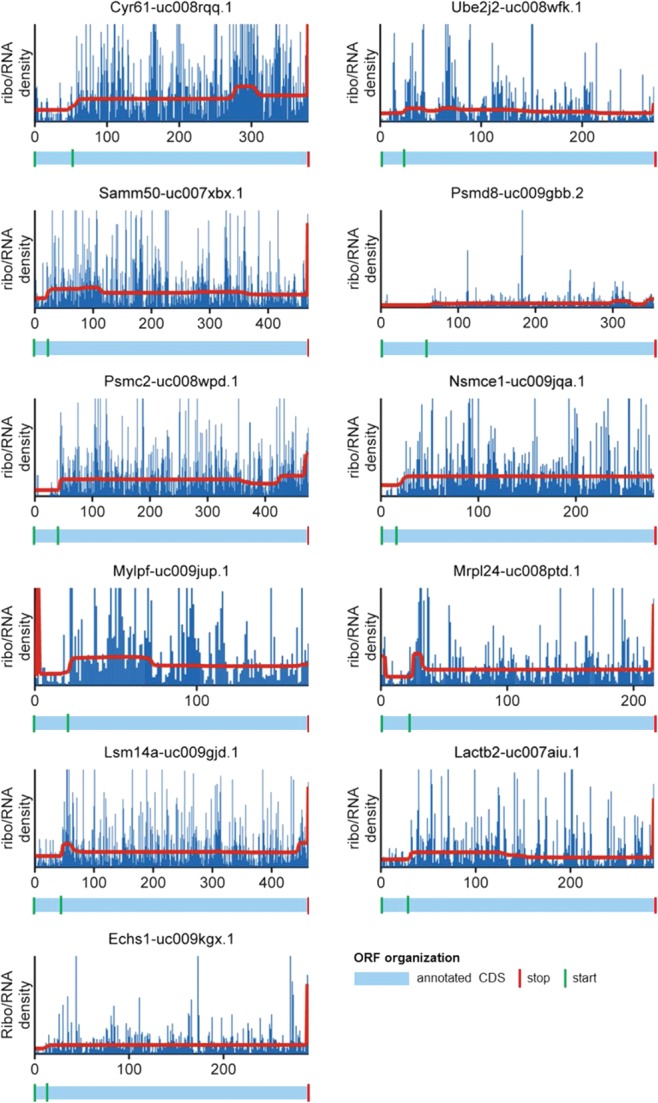
FIGURE 7.

Genes with alternative initiation. Ribo/RNA profiles are shown in blue, and the segments of equal density estimated by the CP algorithm are shown in red. The annotated CDSs are shown below the profiles plots in light blue. Green vertical lines indicate annotated start codons and the newly discovered alternative start codons, while red lines indicate the annotated stop codons.
