
Figure 6. BMI-1 is a direct target of miR-128 and its reexpression partly rescued the decreased proliferation phenotype of miR-128 overexpression.
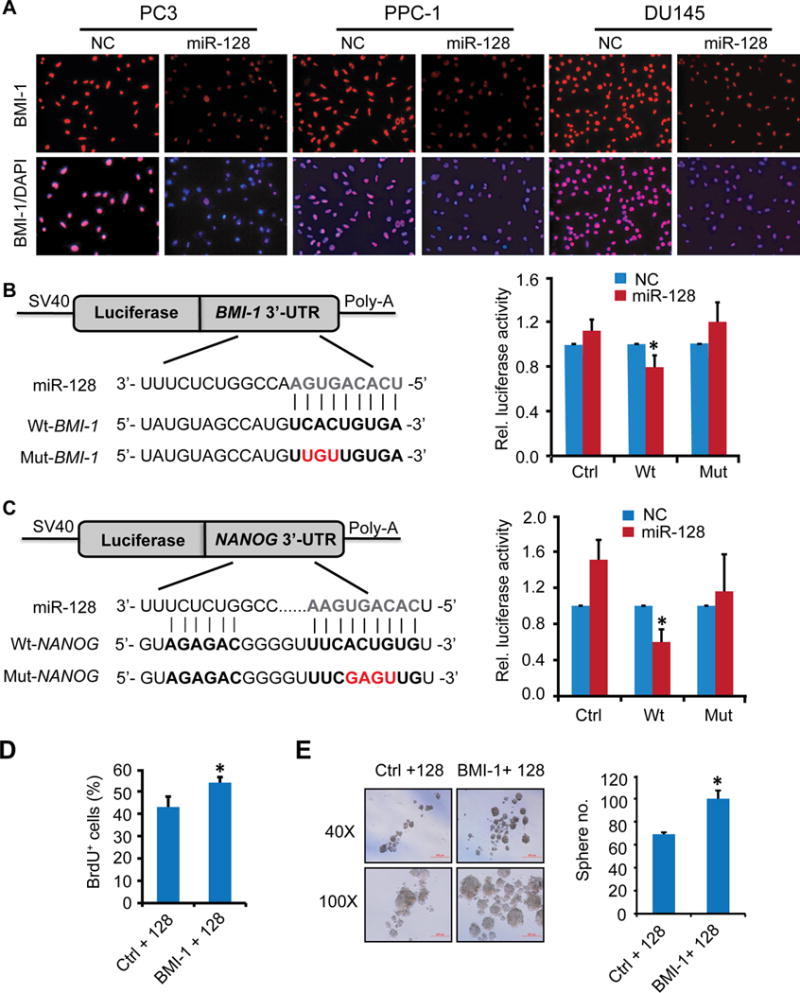
A. Immunofluorescence staining of BMI-1 in 3 PCa cell types. Cells transfected with miR-NC or miR-128 mimic (30 nM, 48 h) were cultured on coverslips overnight followed by immunostaining. Original magnifications, x100.
B–C. Dual Luciferase assays in DU145 cells. Schematic diagram of the BMI-1 and NANOG 3′-UTR pMIR-REPORT constructs (left). Sequences were compared between mature miR-128 and the wild-type (Wt) or mutant (Mut) putative target sites in the 3′-UTR of BMI-1 (top) or NANOG (below). Cells were co-transfected with pMIR-REPORT containing the empty (Ctrl), wild-type (Wt) or mutant (Mut) target site of the BMI-1 or NANOG 3′-UTR plus miR-128 or NC mimic for 48 h. The luciferase activity was normalized to the Renilla activity and presented as relative activity to the corresponding NC (assigned as value “1”). Values denote the mean ± SEM of three independent assays. *P < 0.05.
D–E. Effects of restoring BMI-1 expression on proliferation or sphere-formation ability in DU145 cells as determined by BrdU incorporation (D) and sphere formation (E) assays 72 h after co-transfection with BMI-1 cDNA lacking the 3′-UTR and miR-128 mimic. Error bars represent mean ±S.D obtained from two independent experiments. *P<0.05.