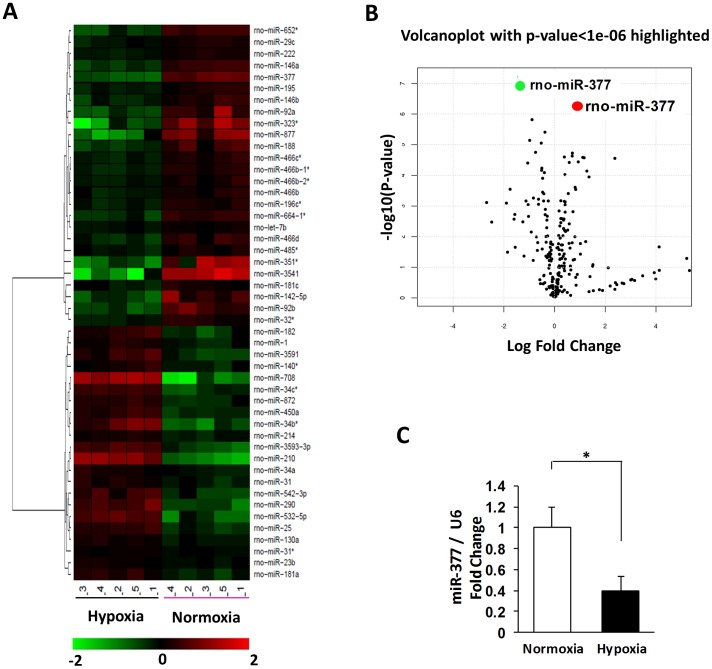
Figure 1. miRNA expression profile is determined in hypoxia-treated mesenchymal stem cells (MSCs).
(A): A heat map of all dys-regulated miRNAs in hypoxia-treated rat MSCs miRNA microarray. All of the miRNA array raw data are available in the online supplemental Table (n = 5 independent experiments). (B): Microarray data are summarized by volcano plot graph, which displays both fold-change and t-test criteria (log odds). MiR-377 and miR-210 are the most significantly dysregulated miRs in hypoxia-treated rat MSCs compared to normoxia-treated MSCs (the green stands for down-regulation, and the red stands for upregulation). (C): Alterations in expression levels of miR-377 was validated by qPCR (normalized to control U6, n = 5, p<0.05).

