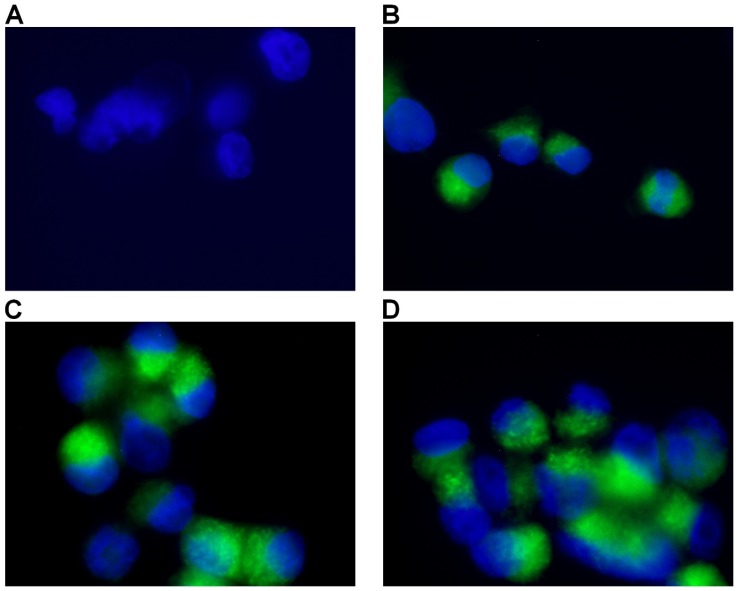
Figure 5.
Detection of Mitochondrial Membrane Potential. Control sample followed standard cell culture conditions. Test cells were treated with MWCNTs-PEG with different concentrations (5, 10 and 50 μg/mL, respectively) and LASER irradiated. Consequently, all samples were stained with Mitochondrial Dual Detection Reagent (15 min, RT, dark) with green fluorescence staining the cells showing mitochondrial membrane depolarizarion. Nucleus staining was also performed using DAPI blue-fluorescence. A: Control sample (no MWCNTs-PEG exposure, no irradiation) No green fluorescence is visible, suggesting membrane potential electrical equillibrium, B: Exposure to 5μg/mL MWCNT-PEG (1 hr, 37˚C), followed by Laser excitation (3 min, 808 nm, 2W/cm2). Reduced green fluorescence staining; C: Exposure to 10μg/mL MWCNTs-PEG (1 hr, 37˚C), followed by Laser excitation (3 min, 808 nm, 2W/cm2), intense, inhomogenuous, granular aspect of green fluorescence staining; D: Exposure to 50μg/mL MWCNTs-PEG (1 hr, 37˚C), followed by Laser excitation (3 min, 808 nm, 2W/cm2).The majority of cells present green fluorescent staining as a result of mitochondrial potential drop. Aspect is intense and widely spread, with fluorescence overlap between adjacent cells.

