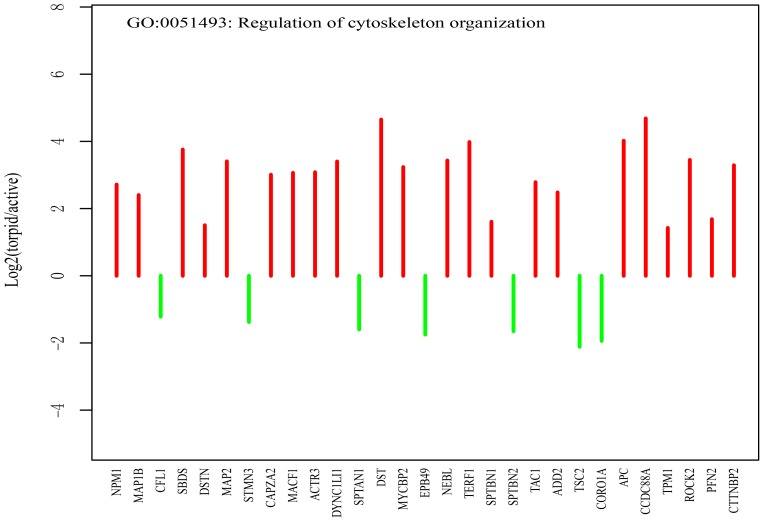
Figure 6. Genes related to stabilization of cytoskeleton (regulation of cytoskeleton organization).
The red lines represent the fold change values of genes up-regulated in the torpid brain, and the green lines represent the fold change values of genes up-regulated in the active brain. The genes are ordered according to their P-values.

