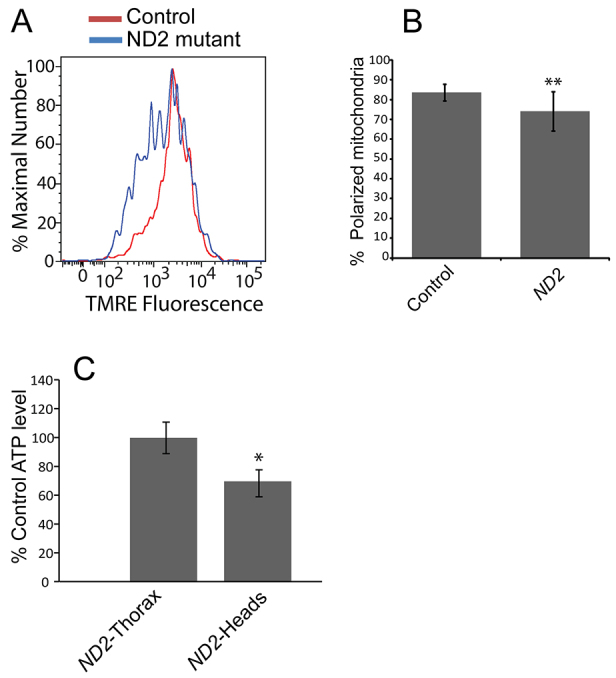
Fig. 4.

ND2 mutants exhibit decreased mitochondrial membrane potential and ATP production. (A) Neurons from 30- to 35-day-old ND2 mutants and controls labeled with the mitochondrial membrane potential dye TMRE were analyzed by flow cytometry. Histograms depict the percent maximal number of cells measured at each TMRE fluorescence intensity. (B) Quantification of the average percent of isolated neurons exhibiting mitochondrial membrane-potential-dependent fluorescence above 103 arbitrary units (% polarized mitochondria) is shown for control and ND2 mutants (P=0.004). Error bars represent standard deviation; n=3 independent brain preparations; **P<0.01. (C) ATP levels were determined in heads of 35-day-old ND2 mutants and controls, and displayed relative to control values (P=0.05). Error bars represent s.e.m.; n=3 groups of 5 individuals; *P≤0.05 for a one-tailed t-test.
