Fig. 5.
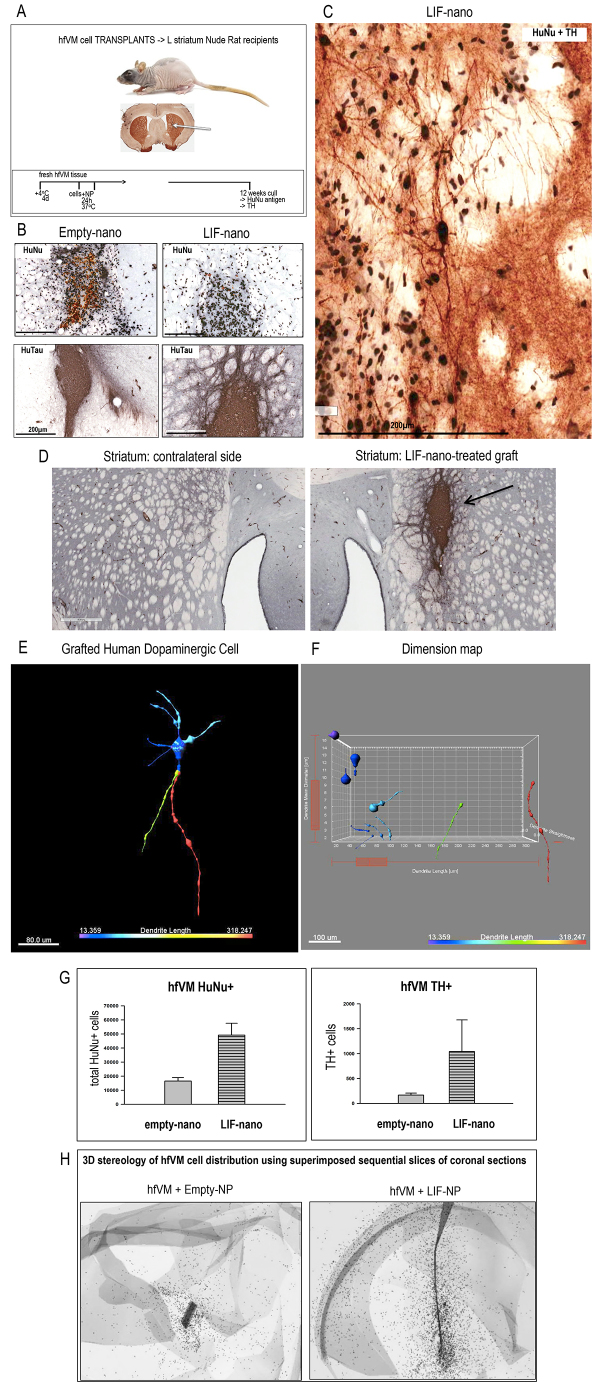
LIF-nano treatment supports the survival and integration of transplanted hfVM cells into the striatum of the nude rat brain. (A) Outlines the protocol for transplantation of hfVM cells into the striatum of nude rat recipients following the procedure described previously (Baker et al., 2000). Briefly, hfVM tissue was stored at +4°C in HibE for 4 days prior to cell preparation and treatment with nanoparticles for 24 hours, then grafted into the striatum. At 12 weeks, recipients were culled and coronal brain sections stained. (B) Low-power photomicrographs of recipient striatum 12 weeks post-grafting with hfVM cells treated ex vivo with either empty-nano (left panels) or LIF-nano (right panels): sections were stained either for human nuclear antigen (HuNu: black nuclei show living cells, yellow/brown nuclei are dead cells) or for human tau (HuTau, dark grey). Dead cells were more apparent in empty-nano-treated grafts, which also had fewer HuTau+ neurites extending within the host tissue compared with the LIF-nano-treated grafts. (C) High-power photomicrograph showing double-positive TH and HuNu human DA cells that have matured in the rat striatum. (D) Low-power photomicrographs comparing graft site with contralateral striatum stained for HuTau. Note HuTau positivity extending beyond the main graft area (arrow). Scale bar: 500 μm. (E) High-power image of a TH+HuNu+ cell in a graft where the image has been processed using Imaris Filament Tracer software: colours relate to the dimensions of neurites and the cell body. (F) Dimension map of the human DA cell shown in E, using Imaris XT analysis of cell body and neurite diameter, size and shape. (G) Histograms comparing numbers of total HuNu+ cells (left panel, P=0.058) and double-positive TH+HuNu+ cells (right panel, P=0.362) 13 weeks after transplantation into the striatum of nude rats. Each recipient animal was analysed. Some 2% of the HuNu+ cells were DA based on co-staining for TH. (H) Three-dimensional stereology using superimposed sections to show the distribution of HuNu+ cells throughout the recipient brain. Cell staining images were taken with a Leica fluorescence microscope with a 20× lens and saved with digital ID. Cells were counted manually using ImageJ software (US National Institutes of Health) with cell counter Plugin. All counting was performed blindly and recorded with ID: total TH+HuNu+ neurons and total HuNu+ neurons were calculated in each recipient animal. For stereology, quantification used Neurolucida 10.

