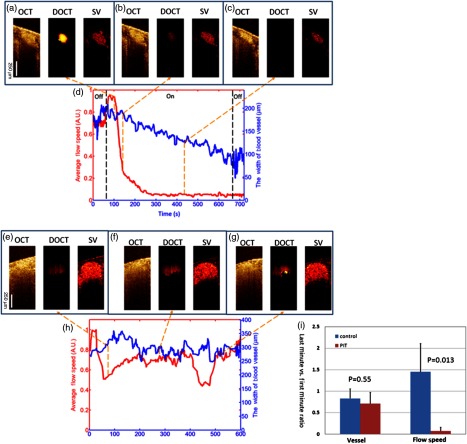
Fig. 3.
Vascular changes in a photoimmunotherapy (PIT)-treated and a control tumor blood vessel. (a to c) Representative OCT/DOCT/SV images at different time points (indicated by the orange dashed lines) during the PIT treatment. (d) Time plot of the blood velocity (red line) and the vessel width (blue line). In the first 60 s (indicated by the black dashed line), the laser light is off to obtain baseline information. After 60 s, near-infrared (NIR) laser light is turned on for 10 min (60 to 660 s). The dosage is . In the last 60 s (660 to 720 s), the light is turned off to obtain post-treatment information (indicated by the second black dashed line on the right). (e to g) Representative OCT/DOCT/SV images at different time points (indicated by the orange dashed lines) of a control tumor blood vessel (with NIR light, but no PIT drug). (h) Time plot of the blood velocity (red line) and the blood vessel width (blue line) of the control vessel. The dosage is . (i) Ratio of vessel size and blood velocity in PIT-treated and control tumors (control is NIR irradiation but no PIT drug). The vessel size of PIT-treated vessels (, from 3 mice) is slightly smaller than its size in the first minute, but it is not statistically significant () compared to the control (, 3 mice). On the other hand, the blood velocity of PIT-treated blood vessels drops significantly in the end of treatment compared to the beginning and it is statistically different from the control ().

