
Figure 2.
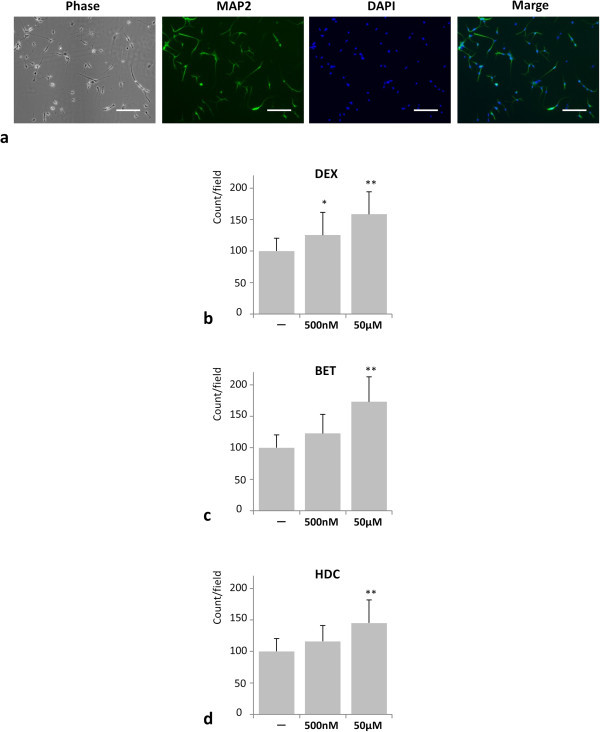
GC treatment promoted cell proliferation of MAP2 positive neurons. (a) Representative pictures of NPCs stained with an antibody against MAP2 (red) and nuclear counterstain DAPI (blue). Phase, phase contrast image. Scale bar, 100 μm. (b-d). Quantification of MAP2 positive neurons using ImageJ. P values were calculated by comparing GC treated with untreated samples (n = 3). *P < 0.05, **P < 0.01. (One-way ANOVA with Tukey-Kramer). The cells were treated with the indicated concentration of (b) dexamethasone (DEX), (c) betamethasone (BET), and (d) hydrocortisone (HDC).