
Figure 4.
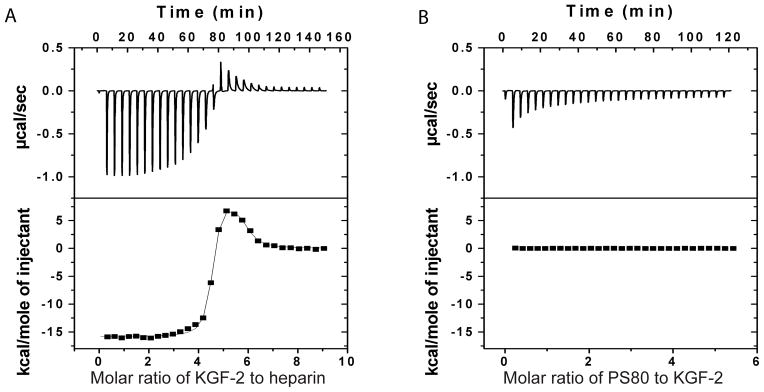
Representative isothermal titration calorimetric (ITC) measurements of KGF2 and heparin (A) or KGF2 and PS80 (B). In panel A, heparin solution (0.005 mM, 1.7 mL) was loaded into the ITC cell, whereas KGF-2 solution (0.2 mM, 305 μL) was loaded in syringe. In panel B, KGF-2 (0.05 mM, 1.7 mL) was loaded into the ITC cell, whereas PS80 (5 mM, 305 μL) was loaded in syringe. The upper panels in A and B are raw data without subtracting the heat of dilution in the control experiments. The lower panels in A and B are the heat per injection from the integrations of data in the upper panels after subtraction of the heat of dilution in the control experiments.